Land-cover changes predict steep declines for the Sumatran orangutan
Land-cover changes predict steep declines for the Sumatran orangutan (Pongo abelii)
Serge A. Wich1,2,*, Ian Singleton3, Matthew G. Nowak3,4, Sri Suci Utami Atmoko5, Gonda Nisam3, Sugesti Mhd. Arif3, Rudi H. Putra6, Rio Ardi7, Gabriella Fredriksson2,3, Graham Usher3, David L. A. Gaveau8 and Hjalmar S. Kühl9,10, *Corresponding author. E-mail: s.a.wich@ljmu.ac.uk
Science Advances 04 Mar 2016:
Vol. 2, no. 3, e1500789
DOI: 10.1126/sciadv.1500789
Abstract
Positive news about Sumatran orangutans is rare. The species is critically endangered because of forest loss and poaching, and therefore, determining the impact of future land-use change on this species is important. To date, the total Sumatran orangutan population has been estimated at 6600 individuals. On the basis of new transect surveys, we estimate a population of 14,613 in 2015. This higher estimate is due to three factors. First, orangutans were found at higher elevations, elevations previously considered outside of their range and, consequently, not surveyed previously. Second, orangutans were found more widely distributed in logged forests. Third, orangutans were found in areas west of the Toba Lake that were not previously surveyed. This increase in numbers is therefore due to a more wide-ranging survey effort and is not indicative of an increase in the orangutan population in Sumatra. There are evidently more Sumatran orangutans remaining in the wild than we thought, but the species remains under serious threat. Current scenarios for future forest loss predict that as many as 4500 individuals could vanish by 2030. Despite the positive finding that the population is double the size previously estimated, our results indicate that future deforestation will continue to be the cause of rapid declines in orangutan numbers. Hence, we urge that all developmental planning involving forest loss be accompanied by appropriate environmental impact assessments conforming with the current national and provincial legislations, and, through these, implement specific measures to reduce or, better, avoid negative impacts on forests where orangutans occur.
Keywords
Great apesconservationhabitat losspredictive modeling deforestation
INTRODUCTION
Ideally, species conservation should be based on a good understanding of the species’ population numbers and the threats to its survival throughout its geographic range. Only with this information is it possible to correctly evaluate the implications of different management decisions (1–6). The total number of individuals is sometimes known for species for which total numbers are very low (7–9); however, such information is not spatially explicit. For some species, abundance estimates exist for parts of their range (10, 11), but we could not find a single example in the literature of a complete spatially explicit abundance estimate for any of these species. The lack of a baseline to evaluate the impacts of different management scenarios on the species of interest severely hampers conservation efforts (12). Even for great apes—species that attract considerable conservation effort—spatially explicit abundance estimates exist for only small parts of their overall distributions (13–15). Although the portions analyzed might themselves be relatively large, the impacts of management strategies can, as such, be assessed for only part of their total range (15). Reasons for the lack of range-wide density estimates for great apes include the cost and the arduous, time-consuming nature of the work involved (16) in often remote and difficult terrains (17, 18).
The need for range-wide population data is particularly relevant for species that are severely threatened, especially those listed as Critically Endangered by the Red List of Threatened Species of the International Union for Conservation of Nature (IUCN), which include the Sumatran orangutan (18, 19). The Sumatran orangutan is threatened mainly by forest loss and illegal killing (18). Forest loss is occurring in both the protected and unprotected forests in the Sumatran orangutan’s range and has been prevalent and most rapid at elevations below 500 m above sea level (asl) and in forests covering peatland (20, 21). The destruction of peat-swamp forests is driven mostly by conversion to oil palm plantations, whereas for forests on mineral soils, conversion is largely for other types of agriculture such as mixed agroforestry, rubber plantations, and candlenut plantations (21). Poaching is confined mainly to the Batang Toru area in the south of the species’ range, but in other areas, orangutans are captured or killed when they leave the forest and venture into agricultural land or areas that have been recently deforested (13).
Government land-use planning decisions have potentially serious negative impacts on the Sumatran orangutan (20–22), and it is thus urgent to develop a good understanding of the size and status of orangutan populations throughout their range. Only then can the different deforestation scenarios be evaluated effectively with regard to their impacts on the species’ abundance. Furthermore, it is important to assess not only the impact on orangutans’ overall abundance but also how deforestation affects populations in different parts of their range; the degree of fragmentation and isolation of the populations is a fundamental issue with regard to the long-term viability of the species (23).
Given the above, the aim of this study is to assess the impact of different land-cover change scenarios on Sumatran orangutan abundance and viability. To achieve this, we conducted a large set of line-transect nest surveys to estimate Sumatran orangutan density throughout their range. We generated a covariate model over the entire range and then investigated the impact of nine land-cover change scenarios on the resulting abundance estimates. We subsequently discuss how each of these scenarios would affect the populations of wild Sumatran orangutans in the immediate future.
RESULTS
We encountered 3166 orangutan nests on 259 line transects (Fig. 1) with a total length of 305.8 km. The mean nest encounter rate was 9.98 nests/km, ranging from 0 to 104 nests/km.
Fig. 1 Map of the study area showing the Sumatran orangutan distribution in northern Sumatra.
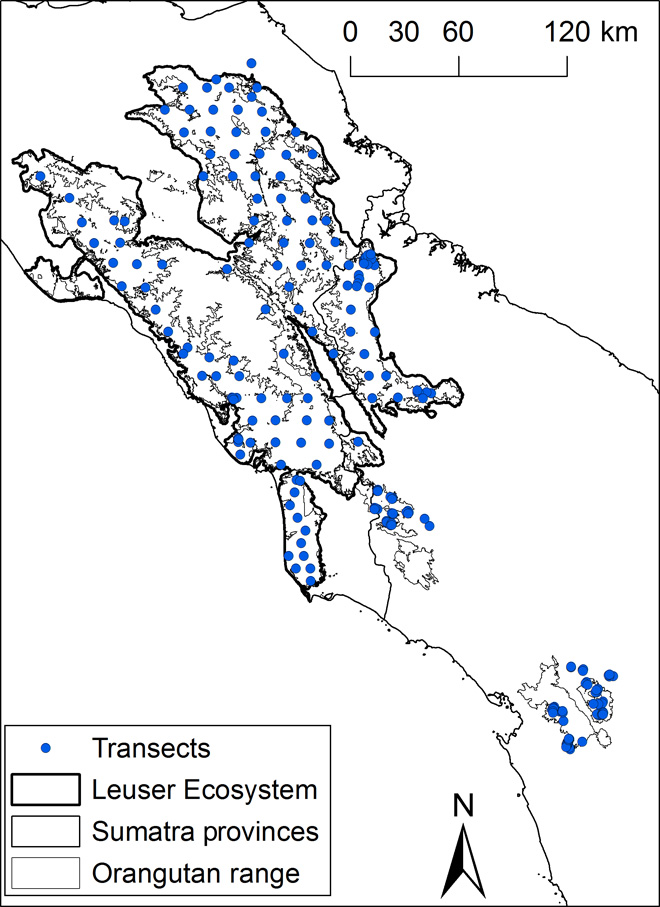
The locations of transects (centroids), the borders of the Leuser Ecosystem and Batang Toru (lower right on figure), and the intermediate areas between the Leuser Ecosystem and the Batang Toru area are shown.
Effective strip width
When various detection functions were fitted to the pooled transect data, the overall model fit was no better than when using only one detection function. We therefore applied a single detection function and resulting effective strip width (ESW) to the entire data set. We used a truncation distance of 32.5 m (n = 114). This left 3052 nests in the data set after nest observations beyond the truncation distance were discarded. The best-fitting model based on the lowest Akaike information criterion (AIC) and a χ2 test was one with a half-normal key function and cosine adjustment terms (tables S1 and S2 and fig. S1). ESW estimated with this model was 16.79 m, and nest detection probability was P = 0.52.
Nest decay
Mean rates of nest decay at the different study sites ranged widely from 143 days in Ketambe to 502 days in Batang Toru (table S3). The number of times a particular decay rate was assigned was highest for the Ketambe decay rate, which is used for nonpeat areas below 300 m. Only a few cells (n = 13) in the model were assigned the very long decay time estimate from the Batang Toru site.
Covariate modeling
Elevation, lower montane forest, mean temperature, and temperature range mainly loaded on factor 1. Factor 2 represents annual rainfall and variation in rainfall. Factor 3 represents peat swamp and lowland forest, and factor 4 represents carbon and forest cover (Table 1). Sumatran orangutan nest density was much better predicted by the full model, including all six covariates and the autocorrelation term, than by the null model, which contained only the autocorrelation term (likelihood ratio test, χ2 = 24.53; df = 6; P < 0.001) (Table 2). Factor 1 (variables related to elevation and temperature), factor 2 (precipitation variables), human population density, and the autocorrelation term had significant effects on Sumatran orangutan density and distribution. Factor 4 (variables related to forest cover) and other interacting variables were of less importance (tables S4 to S6). The model diagnostics, including inspection of residuals, Q-Q plots, and the plotting of observed versus predicted values, did not reveal any issue with model stability or misspecification (fig. S2).
Table 1 Loadings of the predictor variables on the four factors.
Spatial prediction, Sumatran orangutan distribution, density, and abundance estimates
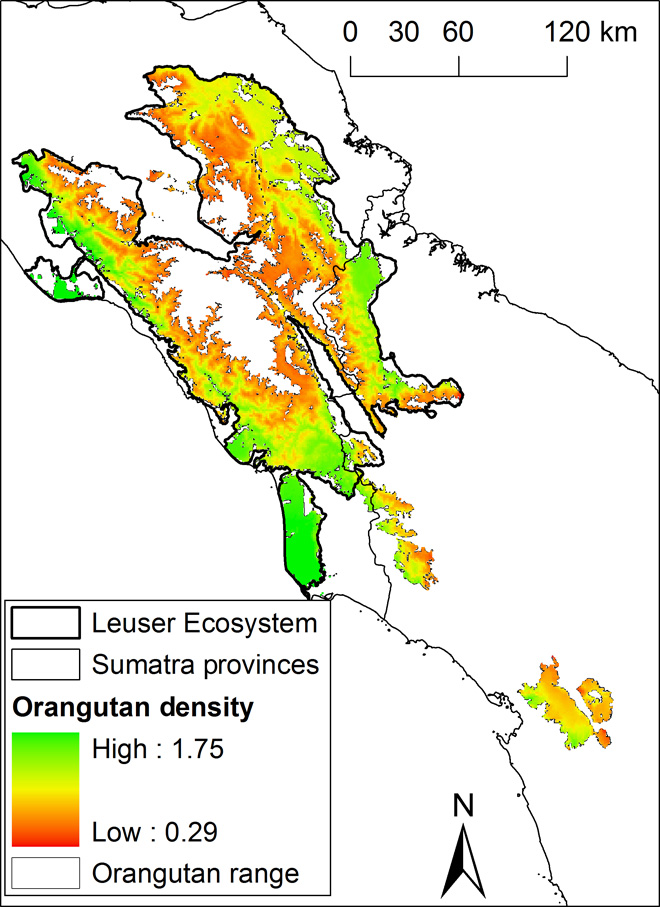
The multimodel predictions of Sumatran orangutan density over their current range of 17,797 km2 yielded an estimate of 14,613 individuals [95% confidence intervals (CIs); range from 14,124 to 15,334] and a mean density of 0.82 individuals/km2 (range, 0.29 to 1.75; Table 3, Fig. 2, and figs. S3 to S12). Excluding populations that are smaller than 250 individuals, we estimate that 13,853 orangutans occur in viable populations on the basis of a 1-km barrier to orangutan dispersal through nonforest areas (for 5-km barrier results, consult figs. S13 to S23 and table S7). The design-based estimate yielded an orangutan population size of 13,938 (95% CI, 11,561 to 16,805) and a density of 0.73 individuals/km2. Density was predicted to be highest in the peat-swamp areas and the lowlands of the Leuser Ecosystem (Fig. 2).
Table 3 Abundance estimates for current orangutan distribution and future land-use scenarios based on a 1-km barrier (see figs. S3 to S12 and details in the Supplementary Materials).
Not all land-cover scenarios cover the areas outside the Leuser Ecosystem and Sidiangkat area; so for some models, estimates without those areas are provided for comparative purposes. Note that scenario 5 is for Aceh only. Populations smaller than 250 individuals are not included in the estimates, except for the current estimated total population of 14,613. NA, not applicable.
Fig. 2 Predicted density of the Sumatran orangutan.
Land-cover scenarios
Under all land-use scenarios, and irrespective of 1- or 5-km barriers to orangutan dispersal, Sumatran orangutan numbers are expected to decline (although the reductions were relatively smaller under the 5-km barriers to dispersal; table S7 and fig. S13) (Fig. 3, Table 3, and figs. S3 to S12). For the 2020 island-wide scenarios (1 and 2), the numbers of orangutans remaining are estimated to range from 72.8 to 89.5% of the current numbers. For 2030, the island-wide predictions (3 and 4) range from 67.2 to 85.7% of the current numbers. The Aceh-only scenario (5) predicts a reduction by 2030 to 68.5% of the current orangutan population size in the province (11,488 individuals). For scenarios (6 to 9) that dealt only with the Leuser Ecosystem and the Sidiangkat area where the majority of orangutans occur, the numbers remaining in 2030 are predicted at 67.4 to 94.3% of the numbers there today.
Fig. 3 Estimated sizes of Sumatran orangutan populations (defined as all adjacent and occupied patches below a distance of 1 km) based on recent surveys and under nine different land-use scenarios for the years 2020 and 2030, respectively.
Populations of the Leuser Ecosystem population are represented by circles, and populations outside the Leuser Ecosystem and the Sidiangkat area are represented by circles bounded by quadrats. The size and color of each circle are proportional to the area inhabited by each population, and the size of the largest population is provided in numbers. At the bottom, the estimated population sizes are given for the entire present (T) and projected Sumatran orangutan populations (in black, A) and for the northern population only, with the areas outside the Leuser Ecosystem and Sidiangkat area omitted (in gray, N). Populations smaller than 250 individuals are not included in the estimates except for the current total number of 14,613. Note that the y-axis values are log-transformed for better visibility of small subpopulations.
The analyses presented here also highlight that relatively few Sumatran orangutan populations are isolated. Depending on the dispersal-barrier distance (1 or 5 km) between forest blocks, the current situation is either three large populations in the Leuser Ecosystem and two much smaller populations outside of the Leuser Ecosystem (Fig. 3 and fig. S3), or one large population in the Leuser Ecosystem and the southern areas adjacent to it and one population in Batang Toru (figs. S13 and S14). The various future land-cover scenarios show increased fragmentation of the current large populations (Fig. 3 and figs. S3 to S23).
DISCUSSION
Our analyses produced a much higher abundance estimate than the 2004 estimate of 6600 Sumatran orangutans (18). This is due to three factors. First, the Sumatran orangutan distribution was truncated (conservatively) at 1500 m asl, instead of 900 m asl as it was for the previous study (18). Second, several areas west of Lake Toba where we now know orangutans occur were not included in the previous analyses. Third, the previous estimate did not include large areas of logged forests, in which the new surveys found orangutans. Because of all three factors, it is now clear that the range of the Sumatran orangutan had been drastically underestimated at 6946 km2 (18). The known current range is now 17,797 km2, roughly 2.56 times larger. It is therefore very important that these results are not interpreted as indicating that Sumatran orangutan numbers have increased, nor that their range has expanded. Since 2004, Sumatran orangutan numbers have undoubtedly declined, and they continue to do so at an alarming rate because of ongoing deforestation (21) and poaching/persecution (13).
Similar to previous studies, the analyses presented here show that Sumatran orangutan densities are highest in peat-swamp forests and lowland forests on mineral soils (18, 20, 24). Recent studies have highlighted the importance of coastal peatland for current and future carbon projects because of the very high carbon content of peat (21) and peatland’s sensitivity to deforestation and drainage, which inevitably leads to subsidence, an increased intake in ocean water, and greater incidences of flooding, leaving the land unsuitable for agriculture (25). Our analyses support the urgent need for a ban on further conversion of peat swamp and highlight its key importance for Sumatran orangutans. The population densities, especially those estimated for peat-swamp forests, are somewhat lower than reported to date (24, 26, 27), but this is likely due to the difference in scale between this survey and previous surveys. If a transect falls into a cluster with many nests, small-scale, transect-based nest density can be very high. However, in our study, we provide orangutan densities on a scale of 1 km2, an area roughly 30 times larger than that covered by a 1-km transect. Our 1-km2 density values thus reflect the averaging of higher and lower fine-scale densities as are found on transects.
The analyses presented here also show that orangutans can be found at elevations higher than previously thought, although their densities decrease with increasing elevation (22). This highlights the importance of maintaining lowland forests and peatlands because they harbor a significant proportion of the remaining Sumatran orangutans. However, the orangutan-rich peatlands and lowland forests of Sumatra are the areas that are most targeted for agricultural expansion (21). In particular, peat-swamp forests are important not only for their role in maintaining orangutans but also for mitigating climate change as a result of their role in the sequestration and storage of huge carbon stocks and in regulating regional hydrologic cycles. When cleared and drained, these wider environmental services are lost because of oxidation and subsidence (21).
High human population densities also have a negative effect on orangutan density. When there are people living near forested areas, orangutan numbers are frequently lower than expected. This could be due to poaching, which occurs in areas such as Batang Toru (13), or to the capture and killing of orangutans that wander into agricultural land and plantations as land is cleared (28–30). The fact that the forest-cover variable had no significant influence on orangutan density indicates that it is only when the human population is high at the forest edge that orangutan numbers decrease significantly.
The different future land-cover scenarios all show a decrease in orangutan abundance that, in the most extreme case, could lead to a 32.8% reduction in numbers by 2030. However, it is very likely that the scenarios that produce the largest declines in orangutan numbers are still underestimates. The main reason for this is that these models do not take into account all roads that have been constructed or are under construction. It is well known that roads lead to deforestation (31–34), and, as such, there is a clear need for careful planning of roads so that the impacts of deforestation can be minimized (35). At the time of writing this paper, the land-use planning proposals for Aceh had not been officially adopted, so there is still a chance that these plans will not be implemented.
Although the Sumatran orangutan is classified as a single species, there are genetically distinct populations. The Batang Toru population is genetically unique; in a phylogenetic analysis, it clustered with the Bornean orangutan for some genetic markers (36, 37). This population is also the most southerly on the island, and because of its unique genetic composition and behavior (38), it is essential that it be conserved. Under one of the scenarios modeled, this population will be lost by 2030: conservation measures are urgently needed for its forests there.
In conclusion, this study indicates that Sumatran orangutans occur higher up the mountains than was previously assumed, and more Sumatran orangutans exist than had previously been estimated. Although this should be positive for the future viability of the Sumatran orangutan, it is important to stress that we have no behavioral or life history data from the orangutans at these high elevations. It is likely that they rely on lower lying areas for food during times of scarcity at higher elevations, such that the loss of lowland areas could affect orangutans residing at higher elevations (39). This would mean that the models in this paper underestimate the impact of land-cover change on orangutans. There is therefore no room for complacency in the efforts to conserve the Sumatran orangutan. Besides providing a baseline for future population assessments, this first ever spatially explicit abundance estimate for Sumatran orangutans across their entire range can be used to inform conservation strategies and land-use planning exercises.
Conservation strategies should focus on two main areas of intervention: First, the assurance that poaching and trading of orangutans is reduced by law enforcement so that poachers and traders are prosecuted and convicted. (This is particularly important because the 5-km dispersal barrier scenario showed less steep declines than the more limited dispersal under a 1-km barrier. Ensuring that orangutans have the opportunity to disperse through nonforest areas is beneficial for their conservation but can only occur when poaching is prevented.). Second, making sure that all land-use planning is accompanied by environmental impact assessments so that the negative impacts on orangutans can be minimized or avoided, most especially through the cessation of road construction and agricultural development in key areas, particularly those where regulations prohibit such activities (16). In addition, agricultural expansion should focus on areas that are suitable for agriculture. This must exclude the peat swamps that are, at present, targeted for oil palm plantations (21). The implementation of these recommendations would lead to a much improved conservation status for the Sumatran orangutan.
MATERIALS AND METHODS
Experimental design
The analytical approaches for estimating orangutan density, distribution, and total Sumatran orangutan population size are a combination of design-based interference (2, 3) and spatial modeling as proposed by Hedley et al. (40) and the use of logistic regression models to estimate decay rates as proposed by Laing et al. (41). This combined approach was successfully applied in a previous study on orangutans in Batang Toru (13).
Sumatran orangutan distribution and survey
The distribution of Sumatran orangutans is taken from a large set of published surveys (18, 21, 24, 42) that were used for earlier assessments of the Sumatran orangutan (18, 21). The distribution used in the current study differs slightly from that published in 2011 (21) because of subsequent additional surveys. The surveys in the present study were undertaken in areas up to 1500 m asl, whereas previous surveys were limited to elevations of below 900 m. A systematic design for 106 line transects in the Leuser Ecosystem was prepared in Distance 6.0 (43). The design used systematic random sampling so that line transects would be spread evenly throughout the Leuser Ecosystem up to an elevation of 1500 m asl. This differed from surveys that do not provide an even coverage of an entire area. A further 153 line transects from other areas were included in this study to cover the entire range of Sumatran orangutans. The systematic surveys were carried out from 2009 to 2011; the additional surveys were conducted from 1999 to 2013.
Covariates
To explain the observed variation in orangutan density, we developed a predictive spatial density distribution model (13, 40, 44). For this, we first identified 10 potentially suitable covariate data sets that were available for the entire geographic range of Sumatran orangutans (table S5). We selected predictors for topography (elevation), ecological and habitat conditions (forest cover, forest type, and aboveground carbon), human impact (human population density and distance from roads), and climate (average annual rainfall, variation in annual rainfall, mean annual temperature, and range of annual temperature). For categorical predictors, we extracted proportions, and for continuous predictors, we calculated the mean value in a neighborhood of half the transect length around each transect midpoint. We also extracted all predictors for a grid with 1 × 1–km cells, covering the Sumatran orangutan’s distribution (17,797 km2), for which we subsequently made density predictions. Here, we set the radius for extraction to 0.1 km around each grid-cell center point.
We ensured that all predictors had approximately symmetrical distributions and then log-transformed the predictor “distance to roads.” Next, we calculated Spearman correlations for the predictors of the transect subset, which showed that some of the variables, such as temperature and elevation, were highly interrelated, as would be expected (table S6). Furthermore, principal components analysis revealed that only one human impact variable—“human population density”—loaded on factors with eigenvalues of ≥1 (45). This was not the case with the other human impact variable—“distance to roads.” Neither of these variables was highly correlated with other predictors (table S6). We therefore did not include these predictors in a subsequent factor analysis (FA) with varimax rotation to reduce the redundancy in the set of predictors. The FA was justified as shown by the Kaiser-Meyer-Olkin measure of sampling adequacy (0.74) and the Bartlett test of sphericity (χ2 = 2174, df = 66, P <0.001) (45, 46). The FA extracted four factors with eigenvalues of ≥1 (Table 1), which together account for 76% of the total variance.
Autocorrelation
Environmental, ecological, and human covariates usually explain a proportion of observed density variation; however, a much larger proportion of the variance can remain unexplained, and this unexplained variance is often partially attributed to “spatial autocorrelation” (that is, a lack of independence between adjacent spatial features and their associated values) between sampling locations (47, 48). Hence, we included an autocorrelation term as a predictor (see the Supplementary Materials), in addition to the aforementioned covariates. All covariates and the autocorrelation term were z-transformed to facilitate model parameter comparisons.
Orangutan nest decay
To convert orangutan nest densities into orangutan densities, the former needs to be divided by nest decay time, daily nest construction rate, and the proportion of nest builders in the population (16, 24). Daily nest construction rate and the proportion of nest builders can only be estimated by observing habituated individuals. We took a mean value of 1.8 constructed nests/day from published literature (24).
To derive nest decay time, we used data sets from the following five sites (with sample sizes): Batang Toru (n = 386), Ketambe above 1000 m (n = 42), Ketambe below 1000 m (n = 85), Marike and Sikundur (n = 80), and Suaq (n = 160). These data sets not only include observations of nests from creation to disappearance but also nests that were still recognizable at the end of the data collection period. These five sites experience different environmental conditions and were therefore used for different parts of the orangutan range: (i) Batang Toru (Batang Toru nest decay); (ii) Leuser Ecosystem above 1000 m (Ketambe above 1000 m nest decay); (iii) all areas at elevations between 300 and 1000 m (Ketambe below 1000 m nest decay); (iv) low altitudes, for nonpeat areas below 300 m asl (Marike and Sikundur nest decay); and (iv) peat swamps (Suaq nest decay). We estimated nest decay time for each site using a logistic model (41) with normalized intercept and used the age of the nest as the only predictor. We estimated mean decay time by summing the product of daily decay probability and time elapsed since the construction over 2000 days (see the Supplementary Materials). We then assigned estimated nest decay times to each transect on the basis of elevation and also assigned, in the same manner, nest decay times to each grid cell for making spatial model predictions.
Estimation of ESW
We estimated the ESW of line transects using Distance 6.0 (43). We ran models on ungrouped data using various key functions and adjustment terms. To test model fit, we used χ2 statistics for which we set distance intervals under the “diagnostics” tab.
Modeling
We used generalized linear modeling to analyze the combined influence of the predictors and to build a predictive density distribution model for the entire Sumatran orangutan geographic range (49). To build an appropriate model, we considered the following issues. (i) Nest survey data are usually skewed—a large proportion of transects have only a few observed nests, and a small number of transects have a large number of nests. To account for this skew, we used a negative binomial error function. (ii) Our data were collected along transects of different lengths. The transects in the systematic survey had a length of 1 km except in the cases where an environmental feature made this unfeasible. The other transects were of variable length. We accounted for this variation by including an offset term to relate the density prediction of the model to the area covered by transects of different lengths (50). In this offset term, we also included nest decay time, proportion of nest building individuals, and nest construction rate, so that the model expression directly predicted orangutan density and not the unit of the response variable (that is, transect nest counts). (iii) To account for spatially autocorrelated residuals of the orangutan density (model predictions), we included an autocorrelation term as an additional predictor in the model (see the Supplementary Materials).
Thus, our full model became as follows: orangutan transect nest count ~ factor 1 + factor 2 + factor 3 + factor 4 + distance to roads + human population density + autocorrelation + offset + error term. To evaluate the combined influence of the six predictors, we ran the full model and compared it with the reduced model containing only the autocorrelation term and none of the covariates. For reasons of model uncertainty in spatial model prediction, we also evaluated all possible combinations of models (n = 104) on the basis of the six covariates, for which we derived AIC and AIC weights.
Density distribution and abundance for present range
We made density predictions across the Sumatran orangutan’s range (for each 1-km2 cell of the grid) by first applying the fitted models to each cell and predictor value. We did this for all 104 models evaluated. For each cell, we then generated a Sumatran orangutan density estimate by summing the AIC-weighted single-model estimates. We used parametric bootstrapping repeated 1000 times to derive 95% confidence limits of the global abundance and for each cell (see the Supplementary Materials). We also estimated total orangutan population size and density by applying a purely design-based approach using Distance 6.0 (43).
Abundance for future range
We then clipped the model predictions of the current Sumatran orangutan density distribution to fit nine potential land-use change scenarios (see the Supplementary Materials for details). These scenarios were developed for Aceh and northern Sumatra and provided projections of orangutan habitat remaining over the next two decades (Table 3 and the Supplementary Materials). All analyses were conducted using R version 2.10 (51) and ArcMap 9.2. To assess the impact of potential fragmentation on orangutans, we made two sets of maps for each land-cover change scenario. In the first set, we treated all forests separated by 1 km or more as having a barrier to orangutan dispersal. In the second set, we treated all forests separated by 5 km or more as having a barrier to orangutan dispersal. Forest patches that contained fewer than 250 individuals were excluded from the abundance estimates because they would not be viable in the long term (52). The orangutan field survey and nest decay data used in this study are available via the IUCN SSC (Species Survival Commission) A.P.E.S. (Ape Populations Environments Surveys) database (http://apesportal.eva.mpg.de).
SUPPLEMENTARY MATERIALS
Supplementary material for this article is available at http://advances.sciencemag.org/cgi/content/full/2/3/e1500789/DC1
Distance analysis
Fig. S1. Histogram of detection distances: truncation distance, 32.5 m; six intervals.
Fig. S2. Model diagnostics for the best and full model.
Fig. S3. Distribution of orangutan populations separated by at least 1 km: Situation as of 2012.
Fig. S4. Distribution of orangutan populations separated by at least 1 km: Scenario 1 (year 2020).
Fig. S5. Distribution of orangutan populations separated by at least 1 km: Scenario 2 (year 2020).
Fig. S6. Distribution of orangutan populations separated by at least 1 km: Scenario 3 (year 2030).
Fig. S7. Distribution of orangutan populations separated by at least 1 km: Scenario 4 (year 2030).
Fig. S8. Distribution of orangutan populations separated by at least 1 km: Scenario 5 (year 2030; note that this scenario is based on land-use change prediction for Aceh only).
Fig. S9. Distribution of orangutan populations separated by at least 1 km: Scenario 6 (year 2030).
Fig. S10. Distribution of orangutan populations separated by at least 1 km: Scenario 7 (year 2030).
Fig. S11. Distribution of orangutan populations separated by at least 1 km: Scenario 8 (year 2030).
Fig. S12. Distribution of orangutan populations separated by at least 1 km: Scenario 9 (year 2030).
Fig. S13. The estimated sizes of orangutan populations (defined as all adjacent and occupied patches below a distance of 5 km) based on the recent survey and under nine different land-use scenarios for the years 2020 and 2030, respectively.
Fig. S14. Distribution of orangutan populations separated by at least 5 km: Situation as of 2012.
Fig. S15. Distribution of orangutan populations separated by at least 5 km: Scenario 1 (year 2020).
Fig. S16. Distribution of orangutan populations separated by at least 5 km: Scenario 2 (year 2020).
Fig. S17. Distribution of orangutan populations separated by at least 5 km: Scenario 3 (year 2030).
Fig. S18. Distribution of orangutan populations separated by at least 5 km: Scenario 4 (year 2030).
Fig. S19. Distribution of orangutan populations separated by at least 5 km: Scenario 5 (year 2030; note that this scenario is based on land-use change prediction for Aceh only).
Fig. S20. Distribution of orangutan populations separated by at least 5 km: Scenario 6 (year 2030).
Fig. S21. Distribution of orangutan populations separated by at least 5 km: Scenario 7 (year 2030).
Fig. S22. Distribution of orangutan populations separated by at least 5 km: Scenario 8 (year 2030).
Fig. S23. Distribution of orangutan populations separated by at least 5 km: Scenario 9 (year 2030).
Table S1. Detection model selected, parameters estimated and their variance, probability density function evaluated at distance zero [f(0)], detection probability (p), and ESW.
Table S2. Results of χ2 goodness of fit test on detection model.
Table S3. Decay times, 95% confidence levels (lower confidence level, upper confidence level) and nest sample sizes from five sites.
Table S4. Summed AIC weights for the six predictors.
Table S5. Selected predictors for the Sumatran orangutan density distribution model.
Table S6. Spearman correlations between all predictors.
Table S7. Abundance estimates for current orangutan distribution and future land-use scenarios based on a 5-km barrier.
References (53–56)
This is an open-access article distributed under the terms of the Creative Commons Attribution-NonCommercial license, which permits use, distribution, and reproduction in any medium, so long as the resultant use is not for commercial advantage and provided the original work is properly cited.
REFERENCES AND NOTES
↵
J. Franklin, Mapping Species Distributions: Spatial Inference and Prediction (Cambridge Univ. Press, Cambridge, UK, 2010).
↵
S. T. Buckland, D. R. Anderson, K. P. Burnham, J. L. Laake, D. L. Borchers, L. Thomas, Introduction to Distance Sampling: Estimating Abundance of Biological Populations (Oxford Univ. Press, New York, 2001).
↵
S. T. Buckland, D. R. Anderson, K. P. Burnham, J. L. Laake, D. L. Borchers, L. Thomas, Advanced Distance Sampling: Estimating Abundance of Biological Populations (Oxford Univ. Press, New York, 2004).
H. G. Andrewartha, L. C. Birch, The Distribution and Abundance of Animals (University of Chicago Press, Chicago, IL, 1954).
G. Caughley, A. Gunn, Conservation Biology in Theory and Practice (Blackwell Science, Cambridge, MA, 1996).
↵
A. B. Rylands, E. A. Williamson, M. Hoffmann, R. A. Mittermeier, Primate surveys and conservation assessments. Oryx 42, 313–314 (2008).
Google Scholar
↵
A. R. Mootnick, B. P. L. Chan, P. Moisson, T. Nadler, The status of the Hainan gibbon Nomascus hainanus and the Eastern black gibbon Nomascus nasutus. Int. Zoo Yearbook 46, 259–264 (2012).
Google Scholar
B. Holst, P. Medici, O. Marinho-Filho, D. G. Kleiman, K. Leus, A. Pissinatti, G. Vivekananda, J. D. Ballou, K. Traylor-Holzer, B. Raboy, F. C. Passos, K. Vleeschouwer, M. Montenegro, Lion tamarin Population and Habitat Viability Assessment Workshop 2005: Final Report (IUCN/SSC Conservation Breeding Specialist Group, Apple Valley, MN, 2006).
↵
L. Jerusalinsky, M. Talebi, F. R. de Melo, Eds., Plano de Ação Nacional para a Conservação dos Muriquis (Série Espécies Ameaçadas 11. Instituto Chico Mendes de Conservação da Biodiversidade. Brasília, 2011).
↵
R. Williams, S. L. Hedley, P. S. Hammond, Modeling distribution and abundance of Antarctic baleen whales using ships of opportunity. Ecol. Soc. 11, 1 (2006).
Google Scholar
↵
R. Williams, S. L. Hedley, T. A. Branch, M. V. Bravington, A. N. Zerbini, K. P. Findlay, Chilean blue whales as a case study to illustrate methods to estimate abundance and evaluate conservation status of rare species. Conserv. Biol. 25, 526–535 (2011).
MedlineGoogle Scholar
↵
K. Kaschner, N. J. Quick, R. Jewell, R. Williams, C. M. Harris, Global coverage of cetacean line-transect surveys: Status quo, data gaps and future challenges. PLOS One 7, e44075 (2012).
MedlineGoogle Scholar
↵
S. A. Wich, G. M. Fredriksson, G. Usher, H. H. Peters, D. Priatna, F. Basalamah, W. Susanto, H. Kühl, Hunting of Sumatran orang-utans and its importance in determining distribution and density. Biol. Conserv. 146, 163–169 (2012).
Google Scholar
H. S. Kuehl, C. Nzeingui, S. Le Duc Yeno, B. Huijbregts, C. Boesch, P. D. Walsh, Discriminating between village and commercial hunting of apes. Biol. Conserv. 142, 1500–1506 (2009).
Google Scholar
↵
E. J. Stokes, S. Strindberg, P. C. Bakabana, P. W. Elkan, F. C. Iyenguet, B. Madzoké, G. A. F. Malanda, B. S. Mowana, C. Moukoumbou, F. K. Ouakabadio, H. J. Rainey, Monitoring great ape and elephant abundance at large spatial scales: Measuring effectiveness of a conservation landscape. PLOS One 5, e10294 (2010).
CrossRefMedlineGoogle Scholar
↵
H. Kühl, F. Maisels, M. Ancrenaz, E. A. Williamson, Best Practice Guidelines for Surveys and Monitoring of Great Ape Populations (IUCN/SSC Primate Specialist Group, Gland, Switzerland, 2008).
↵
J. Junker, S. Blake, C. Boesch, G. Campbell, L. du Toit, C. Duvall, A. Ekobo, G. Etoga, A. Galat-Luong, J. Gamys, J. Ganas-Swaray, S. Gatti, A. Ghiurghi, N. Granier, J. Hart, J. Head, I. Herbinger, T. C. Hicks, B. Huijbregts, I. S. Imong, N. Kuempel, S. Lahm, J. Lindsell, F. Maisels, M. McLennan, L. Martinez, B. Morgan, D. Morgan, F. Mulindahabi, R. Mundry, K. P. N’Goran, E. Normand, A. Ntongho, D. T. Okon, C.-A. Petre, A. Plumptre, H. Rainey, S. Regnaut, C. Sanz, E. Stokes, A. Tondossama, S. Tranquilli, J. Sunderland-Groves, P. Walsh, Y. Warren, E. A. Williamson, H. S. Kuehl, Recent decline in suitable environmental conditions for African great apes. Diversity Distrib. 18, 1077–1091 (2012).
Google Scholar
↵
S. A. Wich, E. Meijaard, A. J. Marshall, S. Husson, M. Ancrenaz, R. C. Lacy, C. P. van Schaik, J. Sugardjito, T. Simorangkir, K. Traylor-Holzer, M. Doughty, J. Supriatna, R. Dennis, M. Gumal, C. D. Knott, I. Singleton, Distribution and conservation status of the orang-utan (Pongo spp.) on Borneo and Sumatra: How many remain? Oryx 42, 329–339 (2008).
Google Scholar
↵
I. Singleton, S. A. Wich, M. Griffiths, M. Pongo abelii. The IUCN Red List of Threatened Species 2008 (2008). URL: http://dx.doi.org/10.2305/IUCN.UK.2008.RLTS.T39780A10266609.en. Downloaded on 04 October 2015.
↵
J. M. Y. Robertson, C. P. Van Schaik, Causal factors underlying the dramatic decline of the Sumatran orang-utan. Oryx 35, 26–38 (2001).
Google Scholar
↵
S. A. Wich, Riswan, J. Jenson, J. Refisch, C. Nelleman, Orangutans and the Economics of Sustainable Forest Management in Sumatra (UNEP/GRASP/PanEco/YEL/ICRAF/GRID-Arendal, Birkeland Trykkeri AS, Birkeland, Norway, 2011).
↵
I. Singleton, S. Wich, S. Husson, S. Stephens, S. Utami Atmoko, M. Leighton, N. Rosen, K. Traylor-Holzer, R. Lacy, O. Byers, Orangutan Population and Habitat Viability Assessment: Final Report. (IUCN/SSC Conservation Breeding Specialist Group, Apple Valley, MN, 2004).
↵
R. Kormos, C. F. Kormos, T. Humle, A. Lanjouw, H. Rainer, R. Victurine, R. A. Mittermeier, M. S. Diallo, A. B. Rylands, E. A. Williamson, Great apes and biodiversity offset projects in Africa: The case for national offset strategies. PLOS One 9, e111671 (2014).
MedlineGoogle Scholar
↵
C. P. van Schaik, A. Priatna, D. Priatna, Population estimates and habitat preferences of orang-utans based on line transects of nests, in The Neglected Ape, R. D. Nadler et al. Eds. (Plenum Press, New York, 1995), pp. 109–116.
↵
A. Hooijer, S. Page, J. Jauhiainen, W. A. Lee, X. X. Lu, A. Idris, G. Anshari, Subsidence and carbon loss in drained tropical peatlands. Biogeosciences 9, 1053–1071 (2012).
Google Scholar
↵
R. Buij, I. Singleton, E. Krakauer, C. P. van Schaik, Rapid assessment of orangutan density. Biol. Conserv. 114, 103–113 (2003).
Google Scholar
↵
S. Wich, R. Buij, C. van Schaik, Determinants of orangutan density in the dryland forests of the Leuser Ecosystem. Primates 45, 177–182 (2004).
MedlineWeb of ScienceGoogle Scholar
↵
G. Campbell-Smith, M. Campbell-Smith, I. Singleton, M. Linkie, Apes in space: Saving an imperilled orangutan population in Sumatra. PLOS One 6, e17210 (2011).
CrossRefMedlineGoogle Scholar
G. Campbell-Smith, M. Campbell-Smith, I. Singleton, M. Linkie, Raiders of the lost bark: Orangutan foraging strategies in a degraded landscape. PLOS One 6, e20962 (2011).
MedlineGoogle Scholar
↵
G. Campbell-Smith, R. Sembiring, M. Linkie, Evaluating the effectiveness of human–orangutan conflict mitigation strategies in Sumatra. J. Appl. Ecol. 49, 367–375 (2012).
↵
D. L. A. Gaveau, S. Wich, J. Epting, D. Juhn, M. Kanninen, N. Leader-Williams, The future of forests and orangutans (Pongo abelii) in Sumatra: Predicting impacts of oil palm plantations, road construction, and mechanisms for reducing carbon emissions from deforestation. Environ. Res. Lett. 4, 034013 (2009).
Google Scholar
W. F. Laurance, B. M. Croes, N. Guissouegou, R. Buij, M. Dethier, A. Alfonso, Impacts of roads, hunting, and habitat alteration on nocturnal mammals in African rainforests. Conserv. Biol. 22, 721–732 (2008).
CrossRefMedlineWeb of ScienceGoogle Scholar
W. F. Laurance, M. Goosem, S. G. W. Laurance, Impacts of roads and linear clearings on tropical forests. Trends Ecol. Evol. 24 659–669 (2009).
CrossRefMedlineWeb of ScienceGoogle Scholar
↵
D. P. Edwards, W. F. Laurance, Biodiversity despite selective logging. Science 339, 646–647 (2013).
FREE Full TextGoogle Scholar
↵
W. F. Laurance, G. R. Clements, S. Sloan, C. S. O’Connell, N. D. Mueller, M. Goosem, O. Venter, D. P. Edwards, B. Phalan, A. Balmford, R. Van Der Ree, I. B. Arrea, A global strategy for road building. Nature 513, 229–232 (2014).
CrossRefMedlineWeb of ScienceGoogle Scholar
↵
A. Nater, P. Nietlisbach, N. Arora, C. P. van Schaik, M. A. van Noordwijk, E. P. Willems, I. Singleton, S. A. Wich, B. Goossens, K. S. Warren, E. J. Verschoor, D. Perwitasari-Farajallah, J. Pamungkas, M. Krützen, Sex-biased dispersal and volcanic activities shaped phylogeographic patterns of extant orangutans (genus: Pongo). Mol. Biol. Evol. 28, 2275–2288 (2011).
Abstract/FREE Full TextGoogle Scholar
↵
A. Nater, N. Arora, M. P. Greminger, C. P. van Schaik, I. Singleton, S. A. Wich, G. Fredriksson, D. Perwitasari-Farajallah, J. Pamungkas, M. Krützen, Marked population structure and recent migration in the critically endangered Sumatran orangutan (Pongo abelii). J. Hered. 104, 2–13 (2013).
Abstract/FREE Full TextGoogle Scholar
↵
S. A. Wich, G. Usher, H. H. Peters, Mokhamad, F. R. Khakim, M. G. Nowak. G. M. Fredriksson, Preliminary data on the highland Sumatran orangutans (Pongo abelii) of Batang Toru, in High Altitude Primates, N. B. Grow, S. Gursky-Doyen, A. Krzton, Eds. (Springer, New York, 2014), pp. 265–283.
↵
R. Buij, S. A. Wich, A. H. Lubis, E. H. M. Sterck, Seasonal movements in the Sumatran orangutan (Pongo pygmaeus abelii) and consequences for conservation. Biol. Conserv. 107, 83–87 (2002).
Google Scholar
↵
S. L. Hedley, S. T. Buckland, D. L. Borchers, Spatial distance sampling models, in Advanced Distance Sampling: Estimating Abundance of Biological Populations, S. T. Buckland, D. R. Anderson, K. P. Burnham, J. L. Laake, D. L. Borchers, L. Thomas, Eds. (Oxford Univ. Press, New York, 2004), pp. 48–70.
↵
S. E. Laing, S. T. Buckland, R. W. Burn, D. Lambie, A. Amphlett, Dung and nest surveys: Estimating decay rates. J. Appl. Ecol. 40, 1102–1111 (2003).
Google Scholar
↵
S. A. Wich, I. Singleton, S. S. Utami-Atmoko, M. L. Geurts, H. D. Rijksen, C. P. van Schaik, The status of the Sumatran orang-utan Pongo abelii: An update. Oryx 37, 49–54 (2003).
Google Scholar
↵
L. Thomas, S. T. Buckland, E. A. Rexstad, J. L. Laake, S. Strindberg, S. L. Hedley, J. R. B. Bishop, T. A. Marques, K. P. Burnham, Distance software: Design and analysis of distance sampling surveys for estimating population size. J. Appl. Ecol. 47, 5–14 (2010).
CrossRefMedlineWeb of ScienceGoogle Scholar
↵
M. Murai, H. Ruffler, A. Berlemont, G. Campbell, F. Esono, A. Agbor, D. Mbomio, A. Ebana, A. Nze, H. S. Kühl, Priority areas for large mammal conservation in Equatorial Guinea. PLOS One 8, e75024 (2013).
MedlineGoogle Scholar
↵
P. K. McGregor, Quantifying responses to playback: One, many, or composite multivariate measures? in Playback and Studies of Animal Communication, P. K. McGregor, Ed. (Plenum Press, New York, 1992), pp. 76–96.
↵
B. G. Tabachnick, L.S. Fidell, Using Multivariate Statistics, (Pearson, Boston, MA, ed. 6, 2013).
↵
C. F. Dormann, J. M. McPherson, M. B. Araújo, R. Bivand, J. Bolliger, G. Carl, R. G. Davies, A. Hirzel, W. Jetz, W. D. Kissling, I. Kühn, R. Ohlemüller, P. R. Peres-Neto, B. Reineking, B. Schröder, F. M. Schurr, R. Wilson, Methods to account for spatial autocorrelation in the analysis of species distributional data: A review. Ecography 30, 609–628 (2007).
CrossRefWeb of ScienceGoogle Scholar
↵
J. W. Lichstein, T. R. Simmons, S. A. Shriner, K. E. Franzreb, Spatial autocorrelation and autoregressive models in ecology. Ecol. Monogr. 72, 445–463 (2002).
CrossRefWeb of ScienceGoogle Scholar
↵
P. McCullagh, J. A. Nelder, Generalized Linear Models (Chapman and Hall/CRC, London, 1989).
↵
S. Hedley, S. Buckland, Spatial models for line transect sampling. J. Agr. Biol. Envir. St. 9, 181–199 (2004).
Google Scholar
↵
R Development Core Team, A Language and Environment for Statistical Computing in R. (R Foundation for Statistical Computing, Vienna, 2008).
↵
A. J. Marshall, R. Lacy, M. Ancrenaz, O. Byers, S. J. Husson, M. Leighton, E. Meijaard, N. Rosen, I. Singleton, S. Stephens, K. Traylor-Holzer, S. S. Utami Atmoko, C. P. van Schaik, S. A. Wich, Orangutan population biology, life history, and conservation, in Orangutans: Geographic Variation in Behavioral Ecology and Conservation (Oxford Univ. Press, New York, 2009), pp. 311–326.
↵
B. F. J. Manly, Randomization, Bootstrap and Monte Carlo Methods in Biology (Chapman & Hall, New York, 1997).
C. Brun, A. R. Cook, J. S. H. Lee, S. A. Wich, L. P. Koh, L. R. Carrasco, Analysis of deforestation and protected area effectiveness in Indonesia: A comparison of Bayesian spatial models. Glob. Environ. Chang. 31, 285–295 (2015).
Google Scholar
J. Miettinen, C. Shi, W. J. Tan, S. C. Liew, 2010 Land cover map of insular Southeast Asia in 250-m spatial resolution. Remote Sens. Lett. 3, 11–20 (2012).
CrossRefWeb of ScienceGoogle Scholar
↵
A. Baccini, S. J. Goetz, W. S. Walker, N. T. Laporte, M. Sun, D. Sulla-Menashe, J. Hackler, P. S. A. Beck, R. Dubayah, M. A. Friedl, S. Samantha, R. A. Houghton, Estimated carbon dioxide emissions from tropical deforestation improved by carbon-density maps. Nat. Clim. Chang. 2, 182–185 (2012).
CrossRefGoogle Scholar
Acknowledgments: We thank R. Mundry for providing R scripts. The Gunung Leuser National Park staff are acknowledged for their support of the study as well as the former Badan Pengelola Kawasan Ekosistem Leuser. We are grateful to M. Griffiths for his support of the study and to the numerous field assistants who have been involved in this project. H.S.K. thanks iDiv (German Centre for Integrative Biodiversity Research) for hosting him. No Institutional Review Board or Institutional Animal Care and Use Committee approval was needed for this study. Funding: We thank the Arcus Foundation, U.S. Fish and Wildlife Service, UNESCO (United Nations Educational, Scientific and Cultural Organization), and Denver Zoo for financial support for the recent surveys and the Robert Bosch Foundation and Max Planck Society for funding. Author contributions: S.A.W., I.S., S.S.U.A., and H.S.K. conceived and designed the study. S.A.W., I.S., M.G.N., S.S.U.A., G.N., S.M.A., R.H.P., R.A., G.F., and G.U. organized the surveys. S.A.W. compiled the data. H.S.K. conducted the analyses. S.A.W. and H.S.K. wrote the paper. D.L.A.G. provided additional data. Competing interests: The authors declare that they have no competing interests. Data and materials availability: All data needed to evaluate the conclusions in the paper are present in the paper and/or the Supplementary Materials. Additional data related to this paper may be requested from the authors. The orangutan field survey and nest decay data used in this study area have been deposited with the IUCN SSC A.P.E.S. database (http://apesportal.eva.mpg.de).
Copyright © 2016, The Authors
| Attachment | Size |
|---|---|
| F1.large_.jpg | 174.79 KB |
| F2.large_.jpg | 208.66 KB |
| Leuser.jpg | 95.67 KB |
»
- Editor1's blog
- Login to post comments